Reproducible spectral scoring with a fit-quality gate
A gate decides whether a score may exist — six spectra all fit at R² 0.988 or better. The reference scores 100; the five stressed samples score 25.4 to 54.0.
Pinned model, pinned thresholds, pinned provenance, 41 tests, and a Pyodide build that matches the native engine. What it caught is the part worth repeating: a component-rescaling step that looked right on every chart, correlation around 0.9, while actual fit quality had gone to −608 with nothing raising an error.
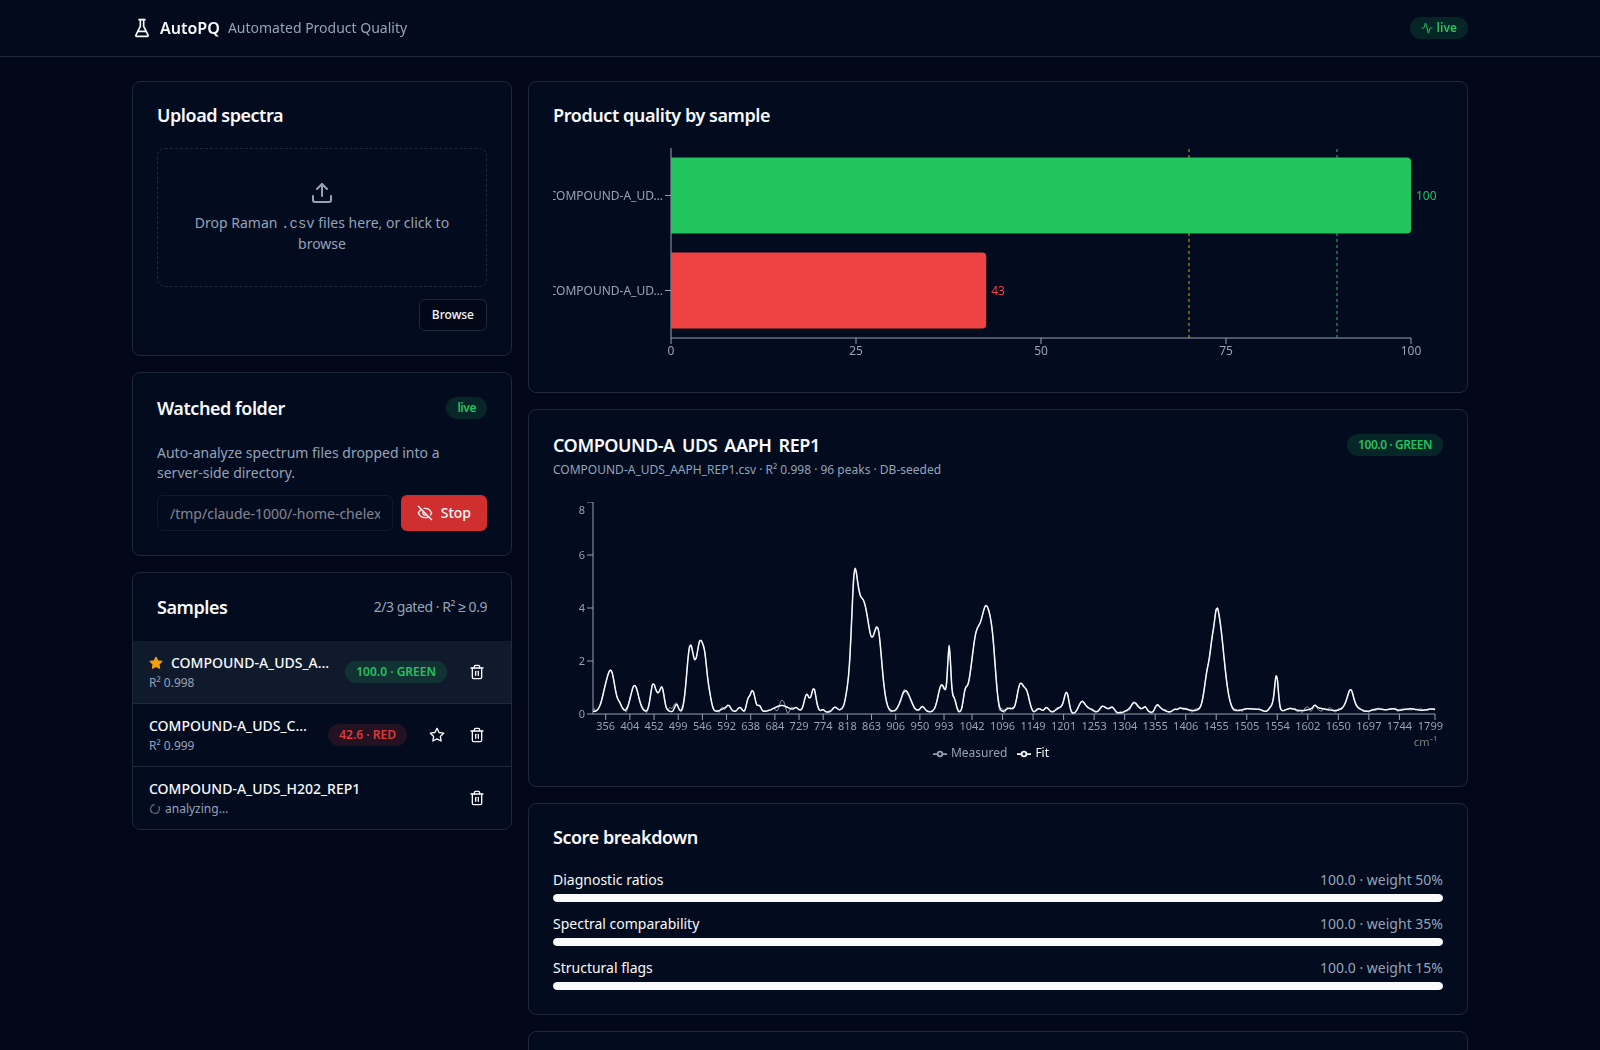
Spectral scoring done in notebooks is not reproducible across analysts, and the reasoning behind a score is not recoverable afterwards. This is a scoring loop with model, thresholds and provenance pinned, covered by 41 tests, plus a browser-native build running the same Python engine in-page through a Pyodide worker — the port reproduces the native reference exactly.
The finding is the part worth carrying anywhere. A post-fit rescaling step matched each component to the data independently, ignoring overlapping neighbours; in dense spectra the rescaled components summed to about 35 times the data. Shape correlation still read around 0.9, so every visual check passed — while R² had collapsed to −608 and every derived ratio was untrustworthy, with nothing reporting an error. The underlying fit had been correct all along.
A quality metric that measures only shape will not notice a magnitude error. Two checks that fail differently are worth more than one check that passes twice. The fix adopts the rescaling only when it does not worsen the residual: R² −608 to 0.98.
References
- Butler et al. (2016). Using Raman spectroscopy to characterize biological materials. Nature Protocols 11(4), 664–687. doi:10.1038/nprot.2016.036
- Newville et al. (2014). LMFIT: Non-linear least-squares minimization and curve-fitting for Python. Zenodo. doi:10.5281/zenodo.11813
No public URL — internal system.